This week the Biomass satellite was launched, one of the most ambitious Earth observation missions by the ESA. Its goal is to measure the amount of forest on Earth and monitor how it is evolving. The long term goal is to help scientists to understand how the forest affects the carbon cycle. Moreover, this satellite is part of a series of new generation of Earth science missions that ESA is currently developing, the upcoming satellites in the series include:
Full detailed satellite mission can be found here
P-BAND
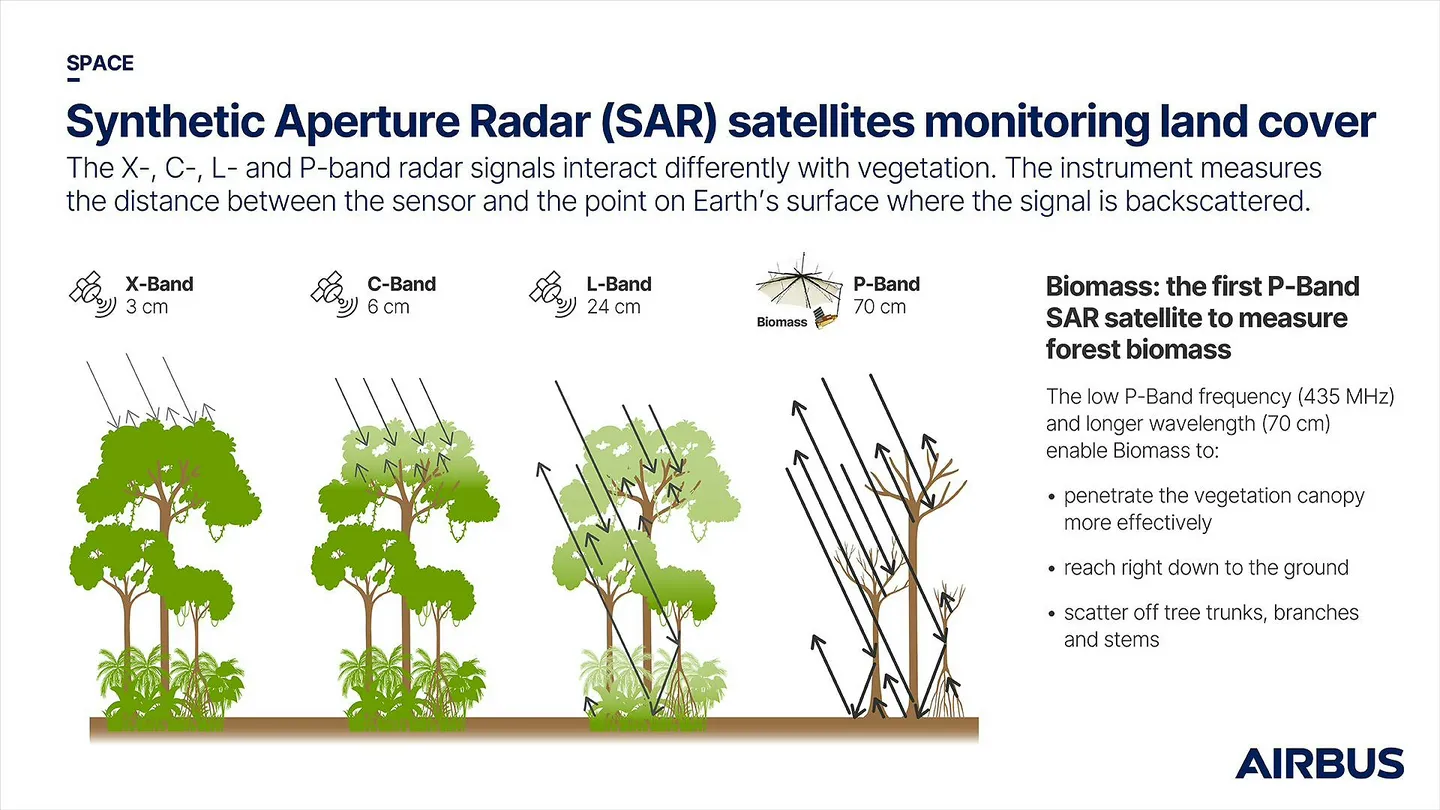
What sets Biomass unique is that it is the first satellite in space to use the P-Band. This frequency band enables the radar to penetrate dense forest canopies, resulting in more detailed images of the forest floor. Additionally, P-Band is not affected by rain or weather conditions, can see the ground clearly, and can estimate the number of leaves on a tree.
Operating between 225 – 390 MHz, with a wavelength of 70–130 cm, the P-Band opens a new opportunities into hidden layers from the space. One of its earliest notable uses was in NASA’s AirSAR project, where a radar-equipped plane surveyed biomass in remote regions. Today, P-Band technology also finds applications in civil engineering, such as detecting underground structures, and in military scenarios like identifying land mines.
For deeper understanding of the P-Band, I highly recommend this presentation.
SAR(Synthetic Aperture Radar)
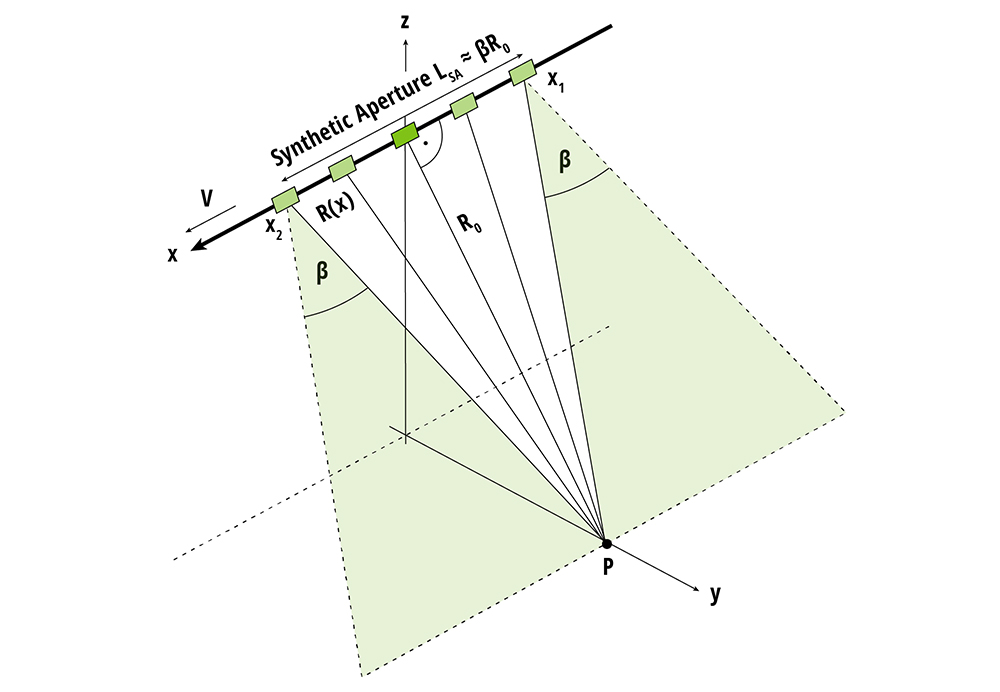
SAR is a type of radar that uses the motion between the antenna and the target to create a synthetic aperture, which is much larger than the physical antenna(Details). This technique allows the creation of high-resolution measurements. In this case, Biomass has a 12-meter antenna. Because it uses microwaves, weather conditions do not affect the measurements. Nowadays, many satellites use SAR. This technology can be used in various bands; here are a few examples:
- X-band (3.8–2.4 cm wavelength): allows high-resolution urban monitoring.
- S-band (15–7.5 cm wavelength): not precise at centimeter levels, but provides general estimations of agriculture and vegetation density.
- P-band (130–70 cm wavelength): offers deeper penetration, useful for examining underground layers, biomass, and vegetation.
There are also three SAR-based technologies that provide different image perspectives:
- SAR Polarimetry (PolSAR): uses different polarizations of radar signals to analyze surface properties.
- Polarimetric SAR Interferometry (Pol-InSAR): combines polarimetry and interferometry to estimate the 3D structure and height of forests and vegetation.
- SAR Tomography (TomoSAR): uses multiple SAR images from different angles to reconstruct a 3D volumetric view.
For SAR, I highly recommend this video.
Ionospheric Distortions
When using the P-Band to measure from space, one of the biggest challenges was dealing with ionospheric distortions. These are caused by Earth's ionosphere, an upper atmospheric layer filled with charged particles, which affects how radar signals travel through it.
The state of the ionosphere is typically characterized by the Total Electron Content (TEC), which measures the number of electrons per square meter. It is usually expressed in TECU (Total Electron Content Units), where 1 TECU equals 10¹⁶ electrons per square meter.
As the radar signal passes twice through the ionosphere (down and back), it experiences a phenomenon called Faraday Rotation, a rotation of the signal’s polarization. This effect can cause rotations of many degrees and may introduce serious errors. In this project, the team estimates the rotation matrix using polarimetric data and corrects the distortions by analyzing the image itself. Several algorithms were tested to estimate Faraday Rotation, and the Bickel & Bates Maximum Likelihood method showed the best performance.
Faraday Rotation is not the only issue caused by Earth's ionosphere. Phase scintillation is another effect that alters the radar signal's phase. It can introduce noise, reduce the measured radar cross-section, and increase sidelobes.
This effect is more severe near the equator and polar regions, where ionospheric activity is stronger due to Earth's magnetic field. To mitigate this, the project uses TEC data derived from Faraday Rotation to generate a phase screen and correct the distortions(details).
You can find more detailed explanations and visualizations in this presentation
Diving deep into the Biomass satellite technology was a joy. It’s one of the most impressive projects I've reviewed from ESA, and I learned a ton. I can't wait to see the discoveries that this satellite brings to us!